Data HQ tool exposes shocking stats on UK water quality
We've launched Data HQ- an online data hub showing real-time sewage data for England, Scotland and Wales as well as shocking sickness stats.
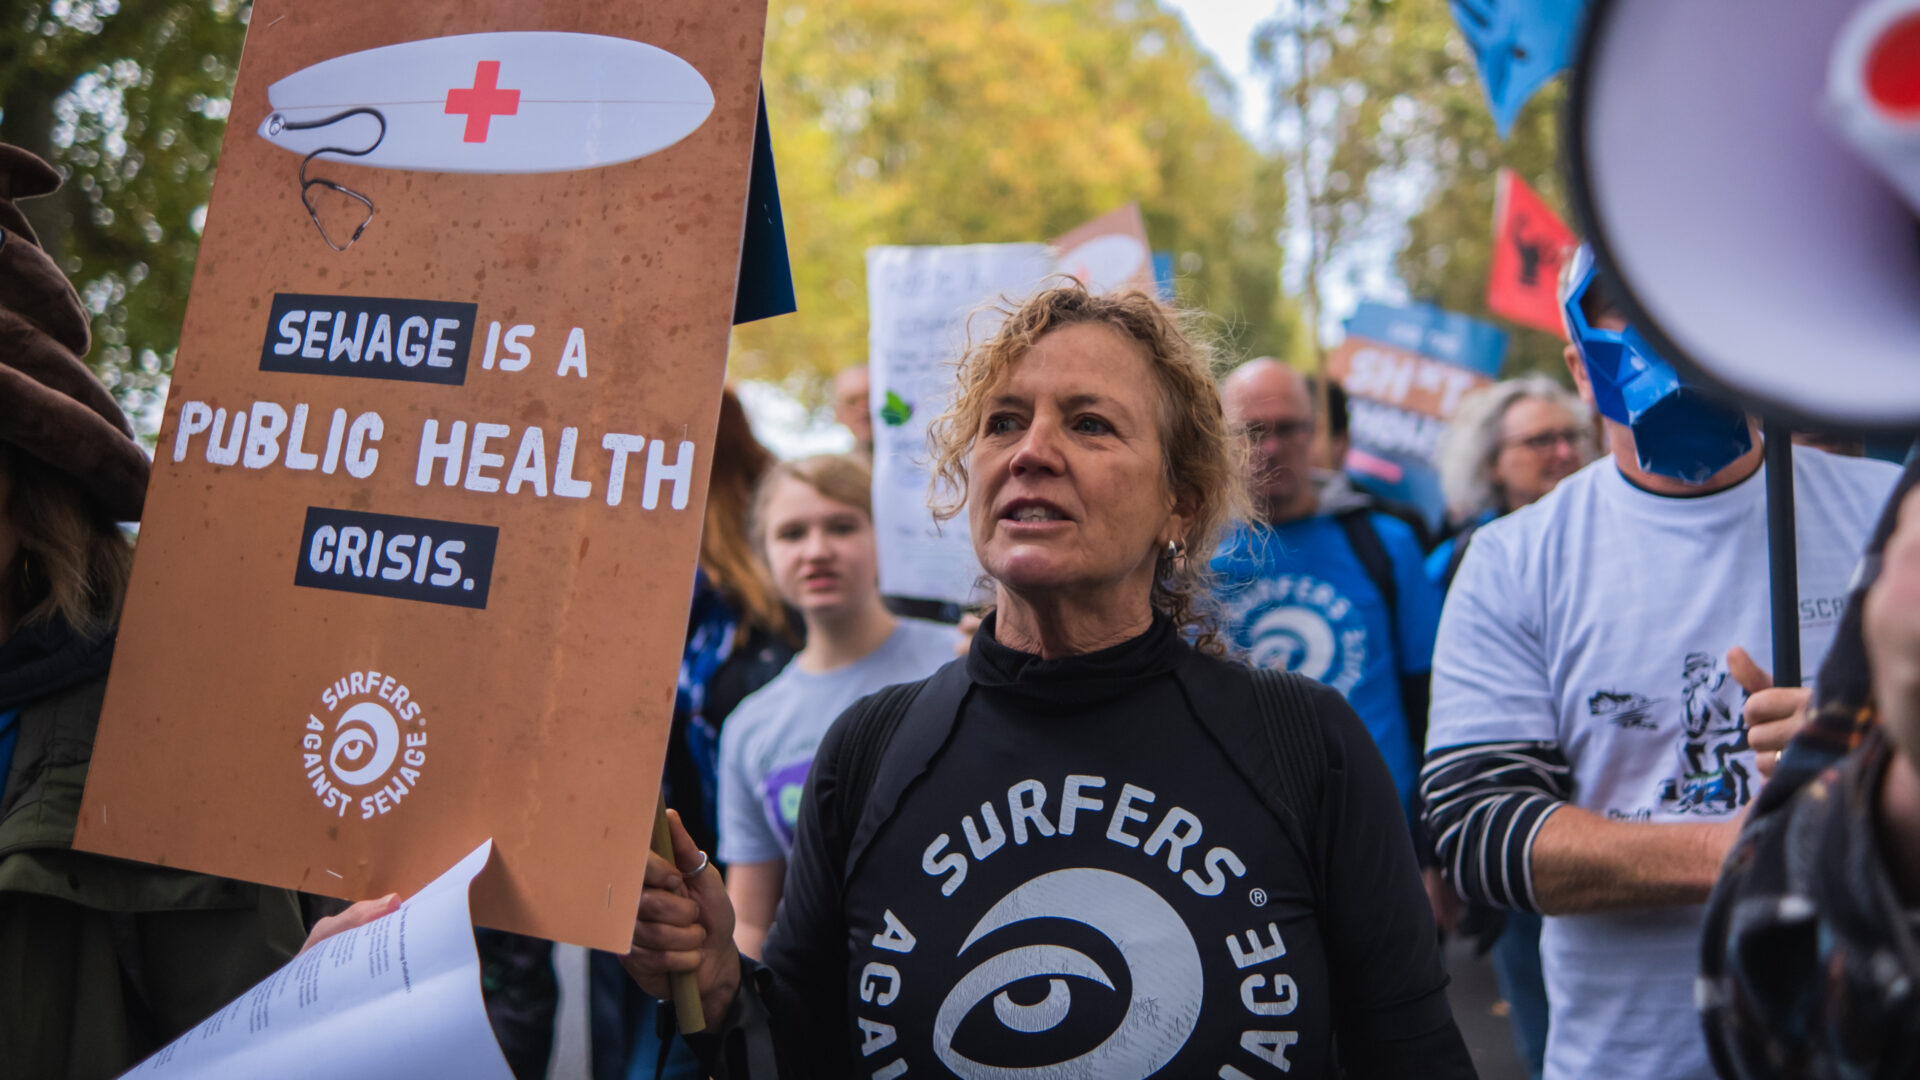
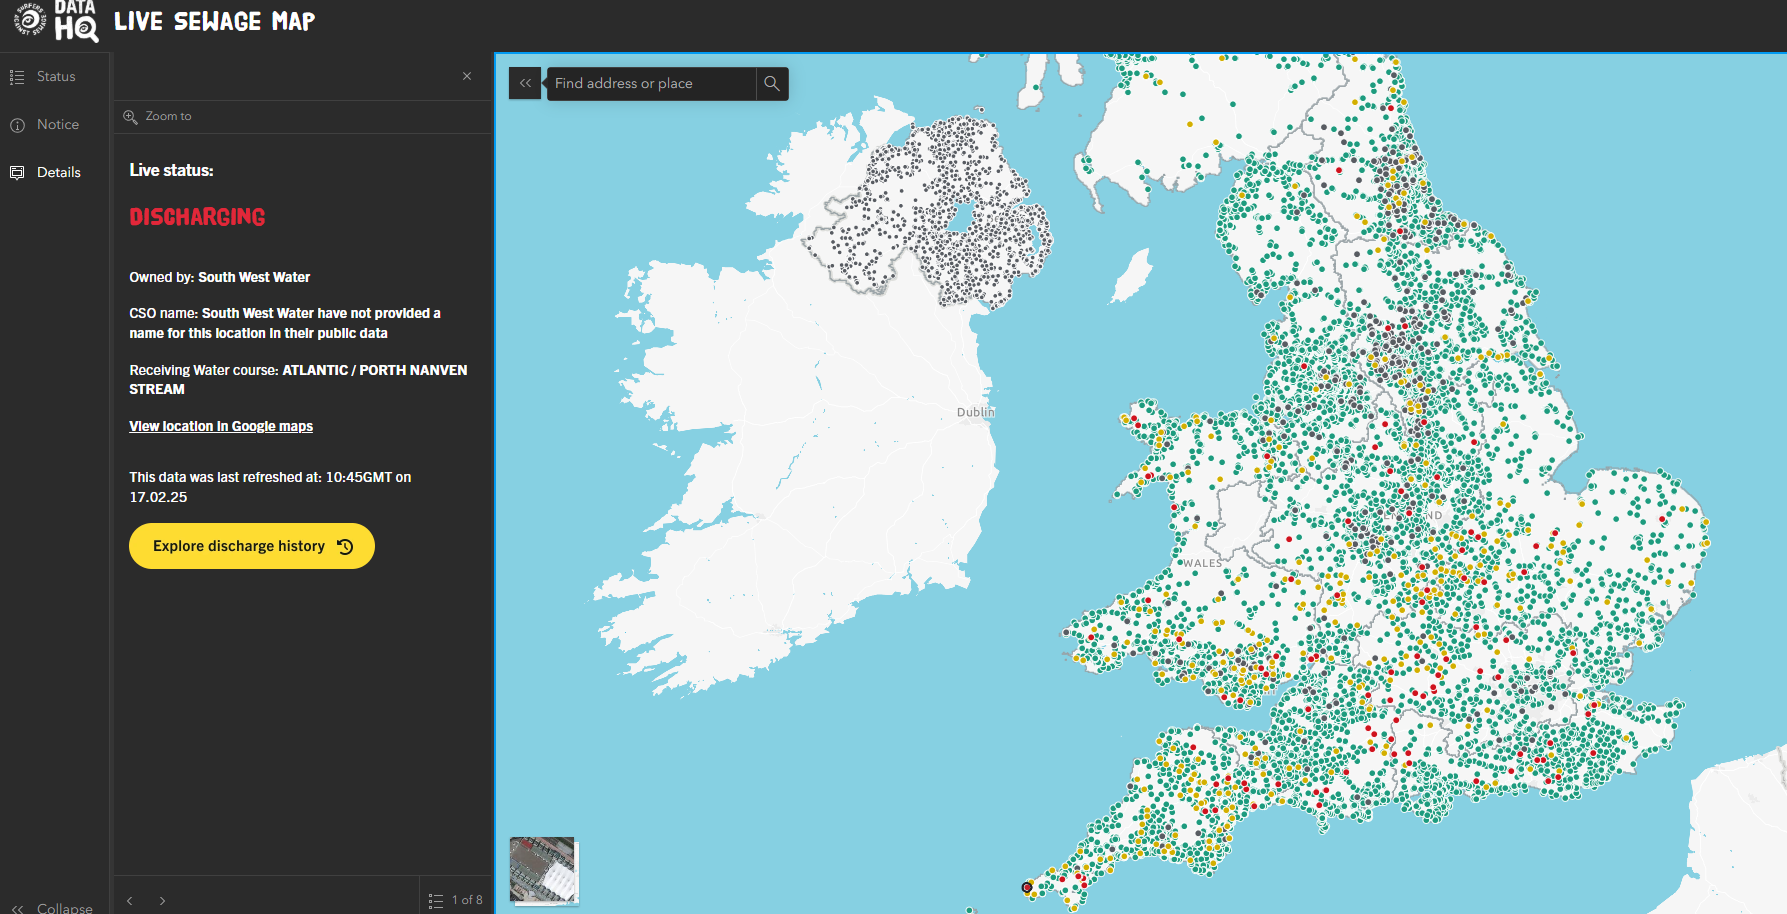
Surfers Against Sewage is exposing the true state of Britain’s waterways through its new online hub for water quality data- Data HQ. With a few clicks, anyone can now view both live and historic data of when and where raw sewage is being dumped into the UK’s rivers and seas via an easy to use, interactive map.
It is the only available resource that shows real-time information on sewage spills for England, Wales and Scotland, as well as historical data on sewage spills in England.
It also provides shocking statistics on where and when people are getting sick from sewage pollution, exposing the threat water companies are posing to human health across the country.
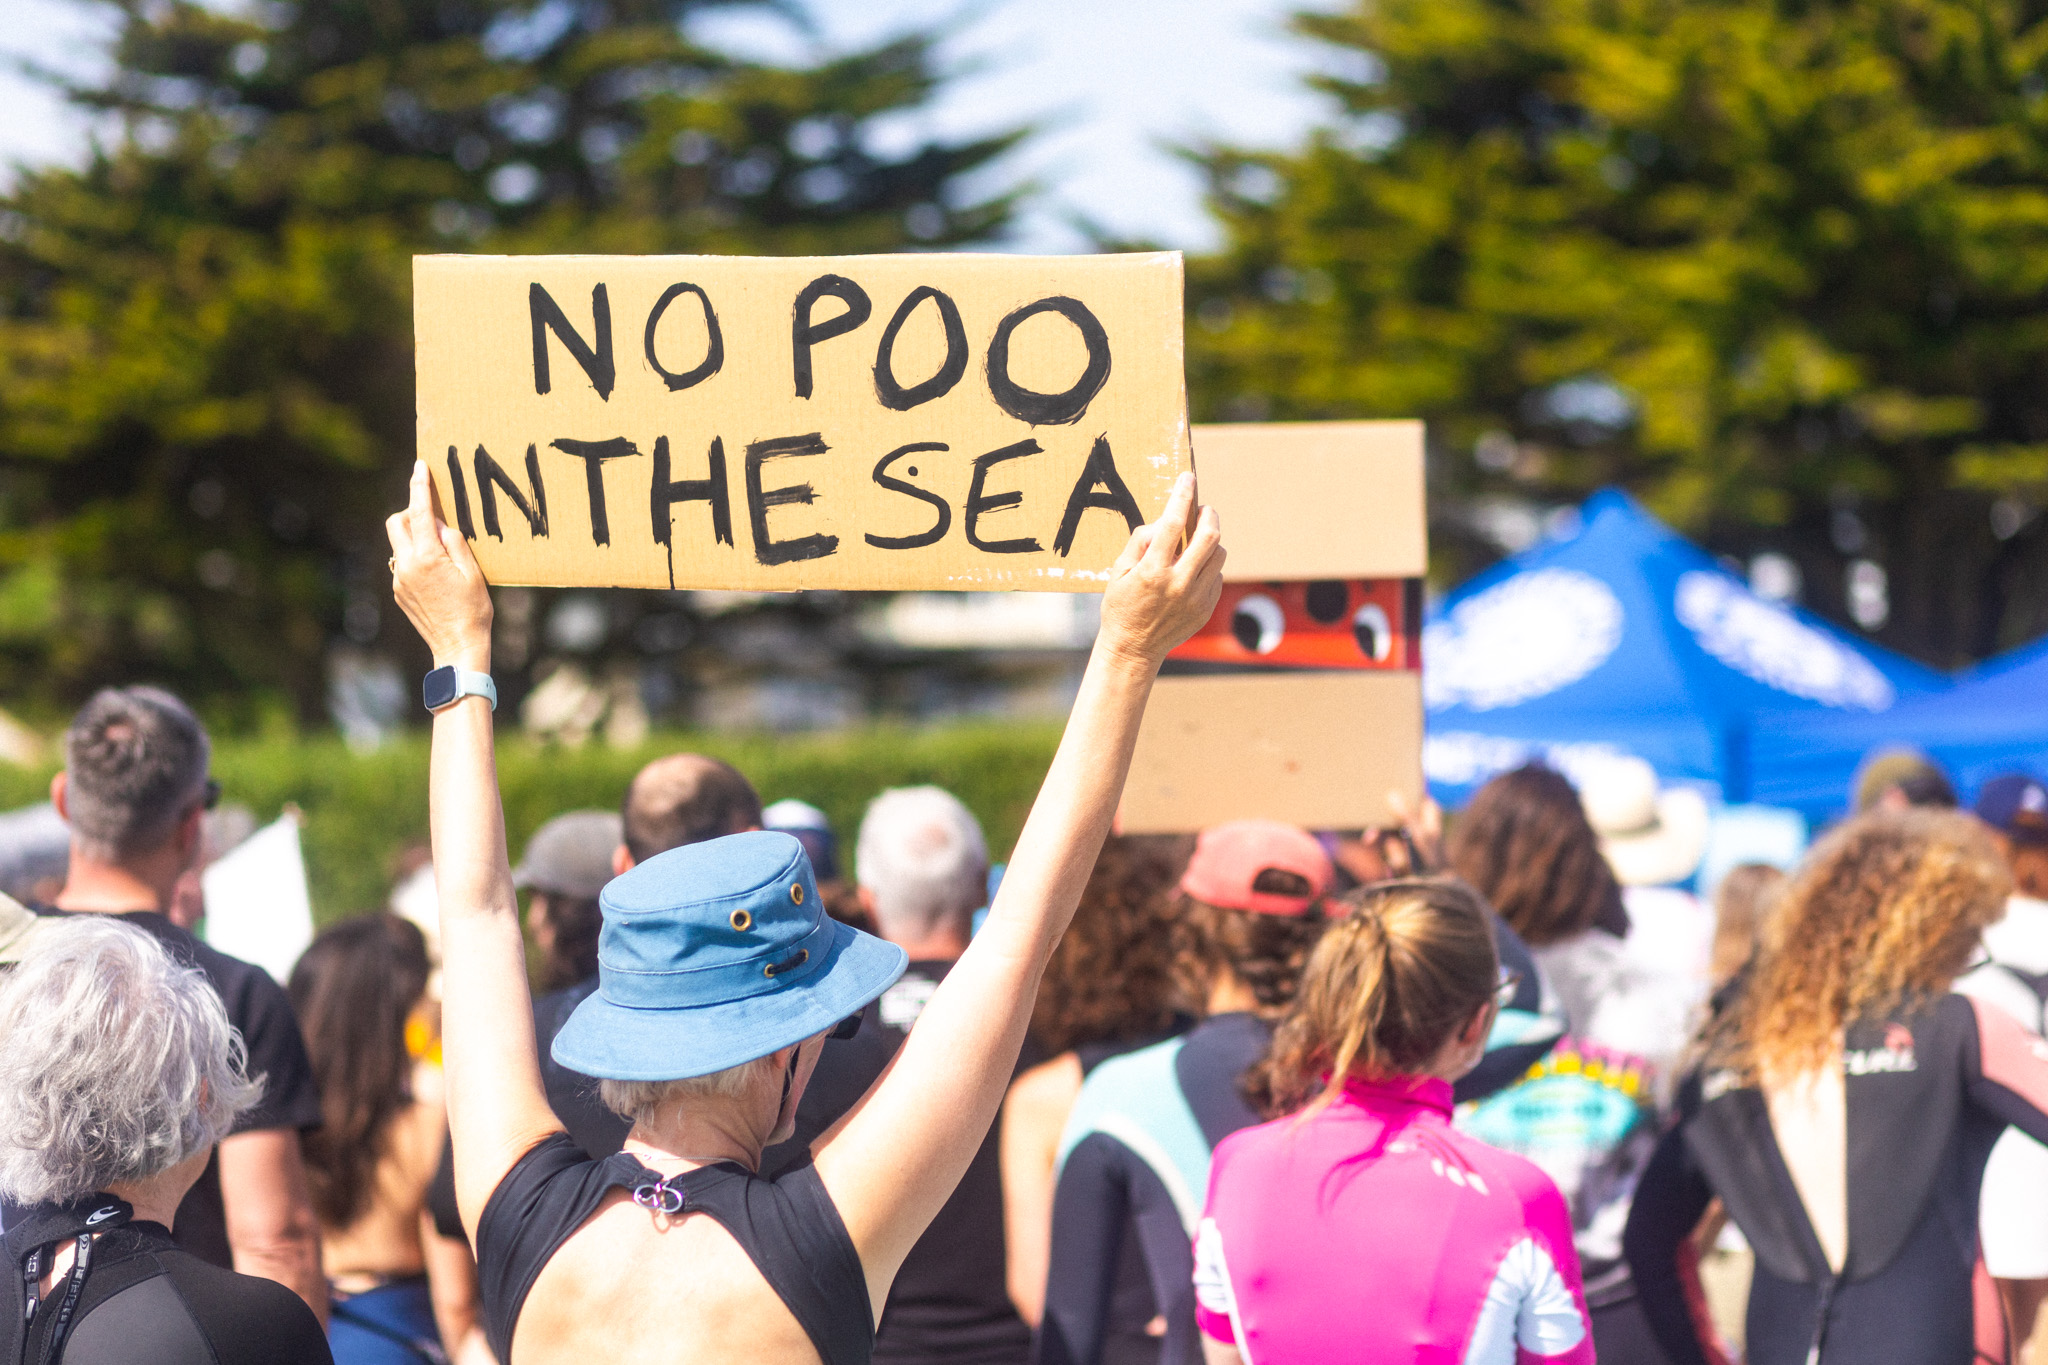
Only six weeks into 2025, the tool is already showing a dire picture of the UK’s blue spaces, with over 68,000 spills logged across England, Wales and Scotland since the beginning of the year. This equates to an average of 2,000 spills a day. This figure is likely to be much higher as not all overflow data for Wales and Scotland is currently available. So far in 2025, 95 sickness cases have been logged by water users around the British Isles equating to 109 workdays lost.
The platform is unique in that it is the only resource available that highlights the numbers of sickness cases submitted by water users. This is thanks to the Safer Seas and Rivers Service (SSRS), which enables the public to share if they have become ill after swimming or surfing, which feeds directly into Data HQ. In the past four years 4,920 sickness reports have been submitted, showing the striking impact that sewage pollution is having on people’s health and wellbeing all across the UK.
The Data HQ tool by SAS allows the public to:
- See real-time information on sewage discharges into rivers and beaches across England, Scotland and Wales on an easy-to-use map. There is currently no data available in Northern Ireland.
- Delve into water quality testing data carried out by communities across the UK, and what this means for the state of the UK’s rivers and coastlines.
- See the shocking stats on exactly when, where and how people are getting sick from after using the water across through data and stories from those affected.
- Explore and add data on how the British public are using our waterways which helps fuel the fight for cleaner rivers, lakes and seas. By logging how our blue spaces are used, it helps SAS to campaign for year-round monitoring to ensure we can surf, swim and paddle safely.
Giles Bristow, Chief Executive at Surfers Against Sewage said: “We are on a mission to make the stories, stats and shocking truth behind the sewage scandal in the UK more visible and accessible to all, and thanks to Data HQ, we can. This tool is going to be instrumental in our fight against sewage pollution by exposing the extent of discharges across the UK both in real-time and historically, which is something that water companies and the national map won’t show you. Why? Maybe they don’t want you to see the full extent of sewage spills in our waters, but now there’s no hiding, or waiting a whole year for water companies to release their figures.
“As well as live data from Scotland, Wales and England, our sewage map now includes a full history for every recorded overflow in England since December 2024, and we are working towards obtaining more and more of this vital data from water companies in the devolved nations. We believe every spill should be logged in real-time, and by making this data accessible, we’re exposing the appalling frequency of sewage spills and the impact on human health caused by our failing water industry. It’s time to lift the lid on the horrifying scale of the UK’s sewage scandal.”
Sam Nichols, Water Quality App Manager at Surfers Against Sewage, leads the Data HQ team. She added: “Our aim is to create a comprehensive UK-wide map that provides users with the fullest possible picture of the dire state of our waterways, to empower communities and equip Ocean Activists with the knowledge and numbers to drive change. Joining our Citizen Science Programme to monitor water quality year-round, logging sickness reports via our sewage alert app, or simply inputting how you enjoy the UK’s blue spaces will help us maximize the platform and supercharge the fight for clean waterways.”